Car Pricing & Value
Trade In Market and Vehicle Depreciation Data 2026
OVERVIEW
If you are thinking about trading in your car, two questions probably matter most: how much value has it already lost, and is waiting likely to cost you more?
There is no single depreciation curve that answers those questions for every vehicle. AutoFinder analyzed 1,769,621 unique used vehicle listings as of October 1, 2026, to see what the current marketplace actually shows.
Across the vehicles included in the analysis, the median advertised price was $26,660, median mileage was 49,826 miles, and median vehicle age was three years.
The data shows some clear patterns. Advertised prices generally declined as vehicles got older. The largest year-to-year drop among vehicles one through five years old occurred between ages two and three. We also found no consistent pricing cliff when vehicles crossed 50,000, 75,000, or 100,000 miles.
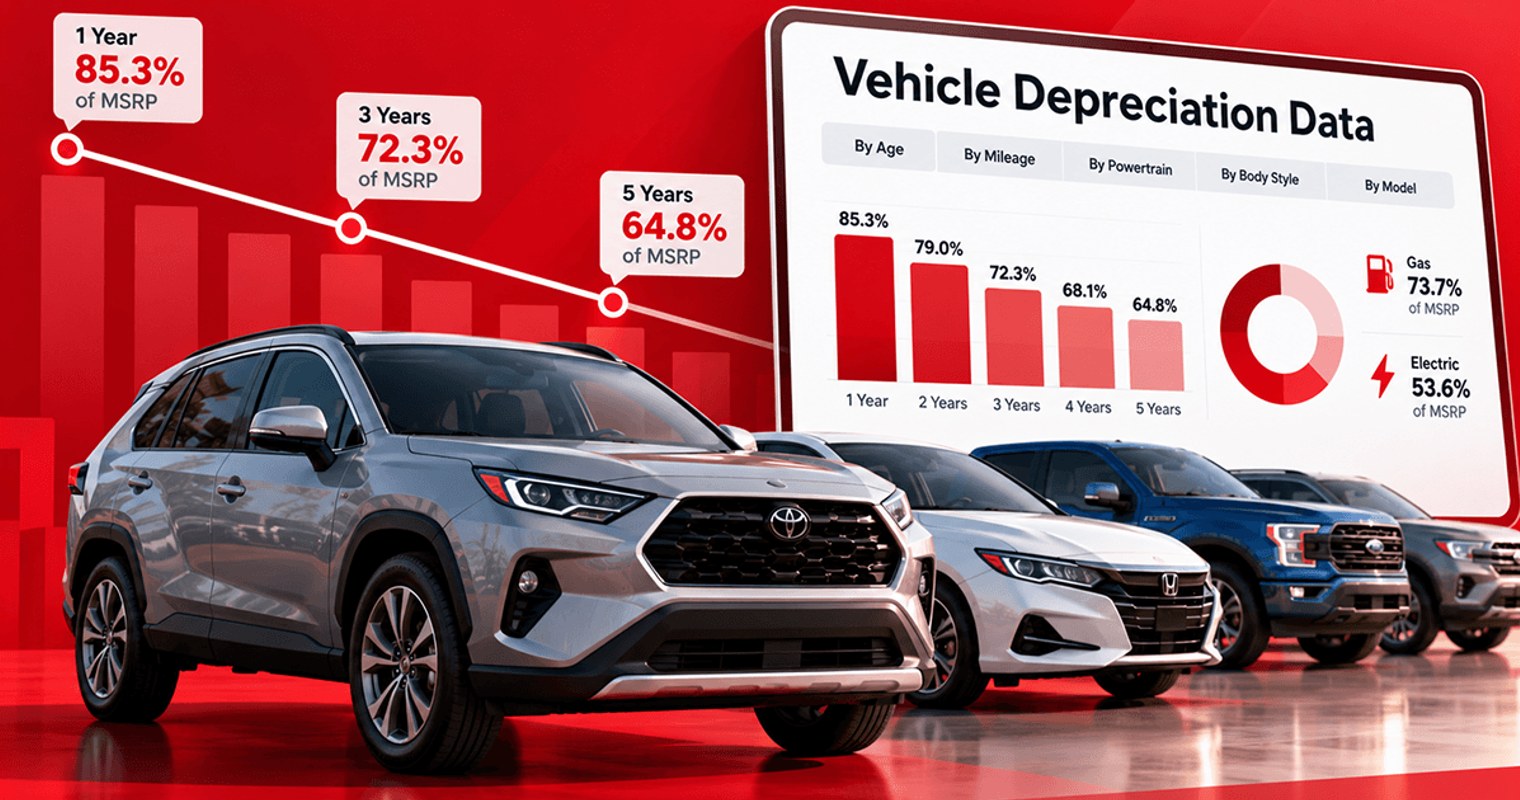
There were significant differences between vehicle types, too. Among three-year-old vehicles, gas models were advertised at a median 73.7% of original base MSRP, compared with 53.6% for electric vehicles.
One distinction is important before getting into the numbers. This analysis looks at dealer-advertised retail prices. It does not measure dealer trade-in offers, wholesale prices, appraisals, or completed transaction prices.
The data can help you understand the market around your vehicle. It cannot tell you exactly what a dealer should offer for it.
What Does AutoFinder's Vehicle Depreciation Data Show?
Four findings stand out:
Advertised prices generally declined as vehicles aged, but not at the same rate every year.
The largest decline among vehicles one through five years old occurred between ages two and three.
There was no consistent, abrupt pricing drop immediately around 50,000, 75,000, or 100,000 miles.
Advertised price relative to original base MSRP varied substantially by powertrain, body style, and model.
These findings give you useful context before an appraisal, but your actual trade-in value still depends on your specific vehicle and the dealer evaluating it.
If you are starting with the basics, How Does Trading In a Car Work? A Complete Guide explains the appraisal process, loan payoff, equity, paperwork, and what happens when you trade your current vehicle toward another one.
How Much Do Used Vehicle Prices Decline With Age?
AutoFinder compared advertised used vehicle prices with each vehicle's original base manufacturer pricing.
Among vehicles one through five years old, advertised price relative to original base MSRP declined at every age we measured.
| Vehicle age | Advertised price vs. original base MSRP | Vehicles analyzed |
|---|---|---|
| 1 year | 85.3% | 240,390 |
| 2 years | 79.0% | 287,149 |
| 3 years | 72.3% | 261,491 |
| 4 years | 68.1% | 146,082 |
| 5 years | 64.8% | 120,641 |
The largest step down in this range happened between ages two and three.
One-year-old vehicles were advertised at a median 85.3% of original base MSRP. That dropped to 79.0% at two years and 72.3% at three years.
The declines were smaller after that. Four-year-old vehicles were at 68.1%, followed by 64.8% for five-year-old vehicles.
Your car will not necessarily follow that exact path. Mileage, condition, equipment, local demand, and changes in new vehicle pricing can all move an individual vehicle above or below the broader pattern.
Why We Use “Advertised Price vs. Original Base MSRP”
You will notice that we do not call these percentages simply “value retained.”
There are two reasons.
First, the current values in this analysis are dealer-advertised retail prices. They are not necessarily what a dealer paid to acquire the vehicle or what a shopper eventually paid for it.
Second, the original price benchmark is the vehicle's base manufacturer pricing. It does not account for every option, package, or destination charge that may have been included on the original window sticker.
That matters especially for vehicles commonly sold in higher trims or with expensive options. A used vehicle can appear to be priced very close to its original base MSRP even though its actual original sticker price was considerably higher.
The percentages are useful for identifying patterns across a large dataset. They should not be treated as exact depreciation rates for an individual car.
Does a Car Lose More Value After Three Years?
Three years stood out in AutoFinder's data, but not because every car suddenly loses value on its third birthday.
Median advertised price relative to original base MSRP moved from:
85.3% at age one
79.0% at age two
72.3% at age three
The 6.7 percentage point decline between ages two and three was the largest year-to-year change among the one through five-year-old vehicles analyzed.
From age three to four, the difference narrowed to 4.2 percentage points. From four to five, it was 3.3 percentage points.
That makes the first few years worth watching if you are already considering a trade. It does not mean you should replace a perfectly good vehicle just to get ahead of depreciation.
Your loan balance, ownership costs, condition, and plans for your next vehicle can matter more than trying to time one point on a depreciation curve.
Is There Really a Mileage Cliff at 50,000 Miles?
You may have heard that you should trade a car before it reaches 50,000 miles because its value will suddenly drop once the odometer crosses that number.
AutoFinder's data did not show a consistent cliff at 50,000 miles.
We also looked around 75,000 and 100,000 miles and found the same general pattern.
Across 15 age and mileage threshold comparisons, differences immediately around those thresholds ranged from approximately 0.8% to 6.9%. There was no universal point where advertised prices suddenly collapsed because an odometer crossed one of those numbers.
Mileage still matters. But in this dataset, it behaved more like a slope than a trapdoor.
What Happens as Mileage Increases?
Four-year-old vehicles provide a useful example.
As mileage increased in 10,000-mile increments, median advertised prices generally moved down by roughly $300 to $1,400 per 10,000 miles, depending on the mileage range.
There was no single threshold where the pattern suddenly broke.
That is useful context if your vehicle is approaching a number such as 50,000 miles. Trading it at 49,900 miles solely to avoid crossing 50,000 may put too much importance on the odometer.
Dealers look at the whole vehicle. Age, condition, mileage, equipment, history, and current demand can all affect an appraisal.
Do Electric Vehicles Depreciate Faster Than Gas Vehicles?
Electric vehicles in AutoFinder's dataset were advertised at a substantially lower percentage of original base MSRP than gas vehicles.
Among three-year-old vehicles:
| Powertrain | Advertised price vs. original base MSRP | Vehicles analyzed |
|---|---|---|
| Gas | 73.7% | 200,194 |
| Electric | 53.6% | 15,840 |
That is a 20.1 percentage point difference.
The gap was not limited to three-year-old vehicles. Electric vehicles showed lower advertised price relative to original base MSRP than gas vehicles across ages one through five in the analysis.
There is an important reason to be careful with that finding.
New EV pricing has changed significantly for some models since those vehicles were originally sold. If a manufacturer later reduces the price of a new EV, comparing an older example with its higher original MSRP can make the depreciation appear especially large.
What we can say confidently is that EVs in AutoFinder's dataset were advertised at a lower percentage of their original base MSRP than gas vehicles. The data does not establish that the powertrain itself caused the entire difference.
Which Vehicle Types Hold Their Advertised Prices Best?
The numbers also varied by body style.
Among three-year-old vehicles:
| Body style | Advertised price vs. original base MSRP |
|---|---|
| Sedan | 76.6% |
| Pickup | 76.1% |
| SUV | 69.7% |
| Minivan | 57.3% |
Sedans and pickups were close in this comparison. SUVs came in lower, while minivans had the lowest median advertised price relative to original base MSRP among these four groups.
That does not make every sedan a strong resale choice or every minivan a poor one.
Each category contains vehicles from different manufacturers, at different price points and with very different trim and equipment mixes. Those differences can influence the category numbers.
For someone preparing to trade a vehicle, the takeaway is simpler: broad depreciation averages only tell part of the story. The specific vehicle matters.
Which Popular Models Held Their Advertised Prices Best?
The differences became even more noticeable at the model level.
Among the 25 most common models in AutoFinder's dataset between two and five years old, several had particularly high advertised prices relative to original base MSRP.
The Toyota RAV4 was at 95.9%, followed by the Honda Civic at 94.9%, Toyota Tacoma at 94.5%, and Honda CR V at 89.0%.
At the other end of the group, the Jeep Grand Cherokee was at 56.1%, Jeep Wrangler at 57.2%, and Jeep Grand Cherokee L at 59.7%.
Toyota models also appeared among the stronger performers when the data was examined separately across vehicle ages two through five.
These percentages require more context than the headline numbers might suggest.
They should not be read as literal depreciation rates for an individual RAV4, Civic, Tacoma or any other model. The analysis compares advertised used prices with original base MSRP, not the original sticker or transaction price of every vehicle.
Trim and equipment mix can materially affect the results. A model with many used vehicles originally sold in trims well above the base configuration can appear particularly strong when its current advertised price is compared with base MSRP.
The model data is most useful for identifying differences within this marketplace snapshot, not predicting what a specific vehicle will be worth in the future.
What Does Depreciation Mean for Your Trade-In?
Depreciation helps shape the market around your vehicle. It does not determine your trade-in offer by itself.
A dealer still has to appraise the actual car in front of them.
Condition, mileage, accident history, equipment, reconditioning needs, local demand, and the dealership's current inventory can all affect what the vehicle is worth to that particular dealer.
There is also a basic economic difference between a retail asking price and a trade-in offer.
If vehicles similar to yours are advertised around $25,000, you should not assume a dealer will offer $25,000 for your trade.
The dealership may need to inspect and recondition the vehicle, prepare it for sale, carry it in inventory, and leave room between what it pays for the vehicle and what it may eventually sell for.
That difference is a normal part of the retail process.
Use advertised pricing as market context rather than treating it as a trade-in quote.
If you already have an appraisal, How to Know If a Dealer's Trade-In Offer Is Fair explains how to compare real offers and evaluate the conditions attached to them.
How Does Depreciation Affect Your Equity?
Depreciation becomes especially important when you still have an auto loan.
Your equity is the difference between what your vehicle is worth as a trade and what you still owe.
Trade-in offer minus loan payoff equals equity
For example, say a dealer offers $22,000 for your vehicle and your loan payoff is $17,000. You have $5,000 in positive equity.
If the offer is still $22,000 but your payoff is $25,000, you have $3,000 in negative equity.
A vehicle can depreciate at a fairly normal rate and still leave you upside down if your loan balance is falling more slowly than the vehicle's value.
Knowing your payoff before you start shopping makes this much easier to see.
If you still owe money on your vehicle, Can You Trade In a Car With a Loan? Negative Equity Explained covers positive equity, negative equity, and the options available when your payoff is higher than your trade offer.
Should You Trade In Before Your Car Depreciates More?
Not just because it is depreciating.
Almost every vehicle loses value over time. Replacing a car sooner may reduce the additional depreciation you experience on that vehicle, but it also means buying another vehicle sooner.
If your current car fits your needs, is reliable, and remains affordable to own, keeping it may make more financial sense than trading solely because its market value is declining.
The decision changes when you were already planning to replace it.
At that point, your current equity, expected ownership costs, condition, and real trade offers become more useful than trying to perfectly time the depreciation curve.
The goal is not to beat depreciation entirely. It is to understand where your vehicle stands before deciding what makes sense next.
Can You Reduce How Much Value You Lose Before Trading In?
You cannot control the used vehicle market, but you can make it easier for a dealer to accurately evaluate your car.
Basic preparation matters. Clean the vehicle, gather maintenance records, bring all available keys, and make sure you know the correct trim and major equipment.
Small problems may be worth addressing before an appraisal. Expensive repairs deserve more thought because you may not recover the full cost through a higher trade-in offer.
For a complete preparation strategy, see How to Maximize Your Trade-In Value in 2026.
What Should You Do With This Data Before Trading In?
Use it as context, not as your asking price.
Start by researching your vehicle accurately. Match the year, model, trim, mileage, equipment, and condition as closely as possible.
Then get a real appraisal.
If possible, compare more than one actual offer. Those offers tell you what buyers are willing to pay for your specific vehicle right now, which is much more useful for a trade decision than applying a national depreciation percentage to your original purchase price.
If you have a loan, compare the best offer with your exact payoff so you know whether you have positive or negative equity.
Then look at the entire transaction if you are buying another vehicle. A higher trade allowance does not necessarily make one deal better if the vehicle you are buying costs more or the financing is less favorable.
Instead of focusing only on “How much has my car depreciated?”, ask:
“Given what my car is worth today, what is the best next move for me?”
The answer may be trading it, keeping it longer, or selling it yourself.
If you are deciding between those last two selling options, Trade In vs. Sell Privately: Which Is Better? compares the potential selling price with the convenience, timing, and work involved in each route.
About the AutoFinder Data
AutoFinder analyzed 1,769,621 unique used vehicle listings with advertised prices as of October 1, 2026.
The figures in this article describe dealer-advertised retail prices for vehicles included in AutoFinder's analysis.
Advertised retail prices are not trade-in offers, wholesale values, or appraisals. They should not be interpreted as total U.S. inventory, vehicle sales, market share, or consumer demand.
Price comparisons with MSRP use original base manufacturer pricing, which excludes options and destination charges.
Because trim, equipment, market conditions, and other factors vary, these findings should be used to understand broad marketplace patterns rather than determine the value of an individual vehicle.
Contact a dealer to confirm current availability, pricing, equipment, and vehicle details.
AutoFinder provides vehicle shopping information for educational purposes. Vehicle values, dealer offers, financing terms, and market conditions vary. Advertised prices do not represent guaranteed trade-in values or transaction prices. Confirm current vehicle information and transaction details directly with the dealership

Get a real offer in 2 minutes
Sell or trade your car 100% online. No haggling, no headaches.

Continue to Carvana to enter your vehicle and get your offer.